
 Google图表(WEB)
# FastWeb之Google图表
- 适用平台:WEB(桌面)
# 1. 说明
该范例使用GoogleChart的图表实现图表的绘制展示。可用该图表实现较为丰富的定义操作。
通过本范例学习,可以掌握UgFSGoogleChart的使用方法。
# 2. 设计明细
开启FastWeb设计器,分别加入下插图之控件。或者点击左上角的[导入]选择模板文件来打开对应模板。
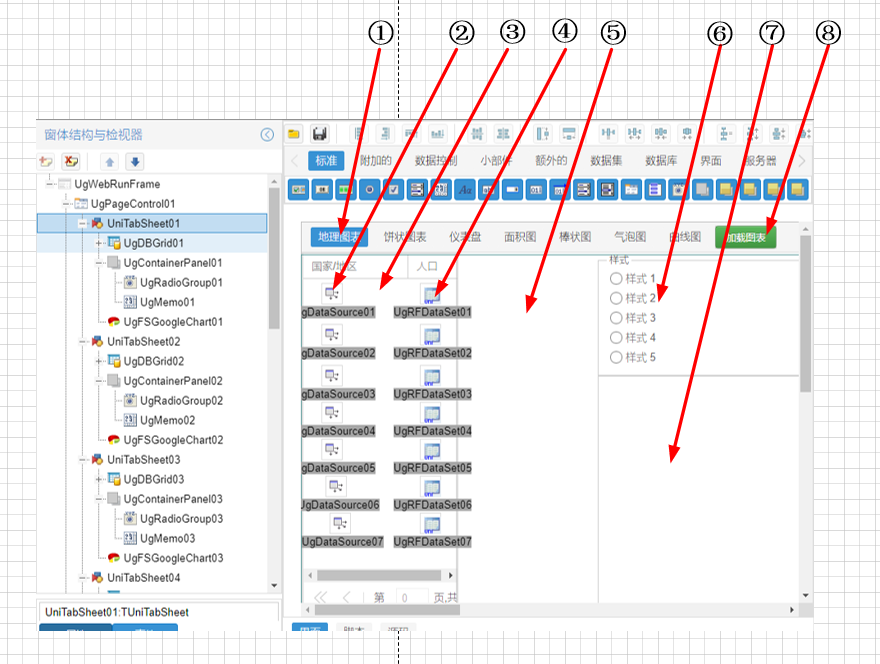
①:TUgPageControl组件,控件名称为UgPageControl01。
②:TUgDataSource组件,控件名称为UgDataSource01-UgDataSource07。
③:TUgDBGrid组件,控件名称为UgDBGrid01-UgDBGrid07。
④:TUgRFDataSet组件,控件名称为UgRFDataSet01-UgRFDataSet07。
⑤:TUgFSGoogleChart组件,控件名称为UgFSGoogleChart01-UgFSGoogleChart07。
⑥:TUgRadioGroup组件,控件名称为UgRadioGroup01-UgRadioGroup07。
⑦:TUgMemo组件,控件名称为UgMemo01-UgMemo07。
⑧:TUgFSButton组件,控件名称为UgFSButton01。
UgWebRunFrame属性设置
Align:设置页面的对齐方式=alClient,即使用客户区对齐的方式。
①UgPageControl01属性设置
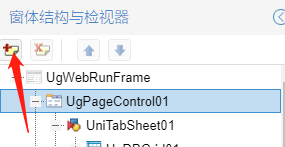
Align:设置页面的对齐方式=alClient,即使用客户区对齐的方式。 在窗体结构与检视器中选择UgPageControl01,然后点击左上角的[添加]按钮添加Tab页面。总计需要添加七个页面,名称为UniTabSheet01-UniTabSheet07。
 分别点击各个TabSheet,修改页面标签的标题
Caption。从左至右的各个TabSheet的Caption分别为地理图表、饼状图表、仪表盘、面积图、棒状图、气泡图、曲线图。 分别点击各个TabSheet,分别放置一个UgDBGrid、UgFSGoogleChart、UgContainerPanel、UgRadioGroup、UgMemo、,每个TabSheet中均包含这些控件,编号分别一一对应。比如UniTabSheet01中放置的是UgDBGrid01、UgFSGoogleChart01、UgContainerPanel01、UgRadioGroup01、UgMemo01。其他页面中的标签依此放置。②UgDataSource01-UgDataSource07属性设置
DataSet:设置对应绑定的数据集,设置为与该控件名称对应序号的数据集控件。,比如UgDataSource01的DataSet属性设置为UgRFDataSet01。
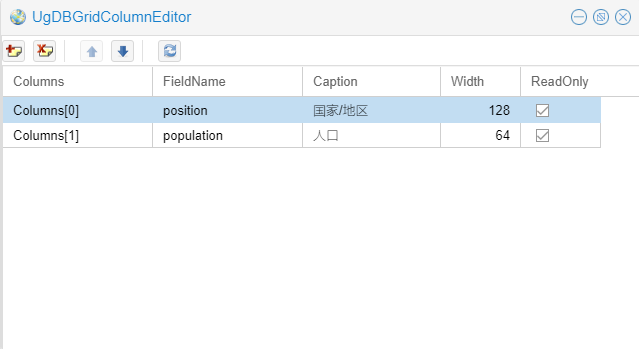
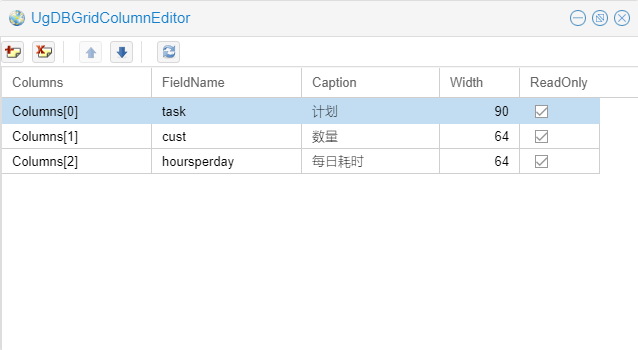
③UgDBGrid01-UgDBGrid07属性设置 双击表格控件,打开字段编辑界面,进行字段编辑。
地理图表字段结构:
饼状图表字段结构:
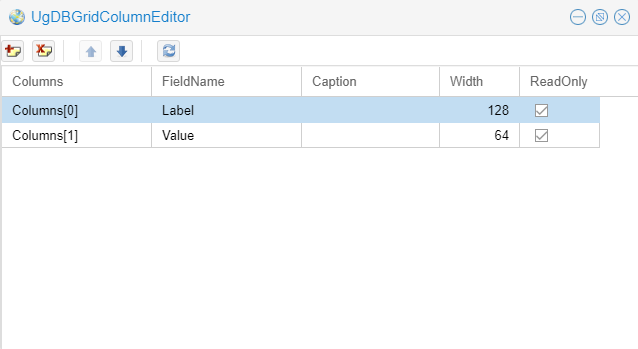
仪表盘字段结构:
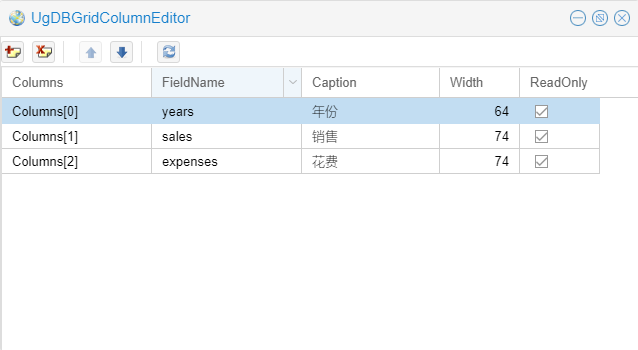
面积图字段结构:
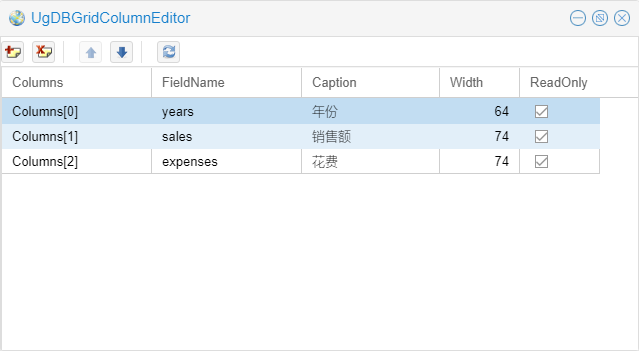
棒状图字段结构:
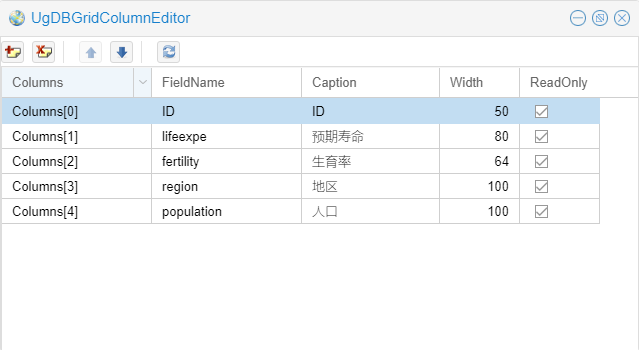
气泡图字段结构:
曲线图字段结构:
DataSource:设置绑定的数据源控件,此处设置序号对应的控件,比如UgDBGrid01的DataSource需设置为UgDataSource01。Align:设置对齐方式,设置为alLeft。
④UgRFDataSet01-UgRFDataSet07属性设置
SQL:设置查询的数据内容,此处需设置为自定义的内容。
UgRFDataSet01
--地理图表数据
SELECT 'Germany' AS position, 200 AS population
UNION
SELECT 'United States' AS position, 300 AS population
UNION
SELECT 'Brazil' AS position, 400 AS population
UNION
SELECT 'Canada'  AS position, 500 AS population
UNION
SELECT 'FRANCE' AS position, 600 AS population
UNION
SELECT 'RU' AS position, 700 AS population
2
3
4
5
6
7
8
9
10
11
12
UgRFDataSet02
--饼状图表数据
SELECT '工作' AS task,CAST('25.20' AS Float) AS cust,11 AS hoursperday
UNION
SELECT '饮食' AS task,CAST('40' AS Float) AS cust, 2 AS hoursperday
UNION
SELECT '交流' AS task,CAST('35.60' AS Float) AS cust, 2 AS hoursperday
UNION
SELECT '看电视' AS task,CAST('10' AS Float) AS cust, 10 AS hoursperday
UNION
SELECT '睡觉' AS task,CAST('30' AS Float) AS cust, 7 AS hoursperday
2
3
4
5
6
7
8
9
10
UgRFDataSet03
--仪表盘数据
SELECT '内存' AS Label,80 AS Value
UNION
SELECT 'CPU' AS Label,55 AS Value
UNION
SELECT '网络' AS Label,68 AS Value
2
3
4
5
6
UgRFDataSet04
--面积图数据
SELECT '2004' AS years,1000 AS sales,400 AS expenses
UNION
SELECT '2005' AS years,1170 AS sales,490 AS expenses
UNION
SELECT '2006' AS years,660 AS sales, 460 AS expenses
UNION
SELECT '2007' AS years,1030 AS sales, 1120 AS expenses
UNION
SELECT '2008' AS years,1080 AS sales, 1000 AS expenses
UNION
SELECT '2009' AS years,1090 AS sales, 540 AS expenses
2
3
4
5
6
7
8
9
10
11
12
UgRFDataSet05
--棒状图数据
SELECT '2004' AS years,1000 AS sales,400 AS expenses
UNION
SELECT '2005' AS years,1170 AS sales,490 AS expenses
UNION
SELECT '2006' AS years,660 AS sales, 460 AS expenses
UNION
SELECT '2007' AS years,1030 AS sales, 1120 AS expenses
UNION
SELECT '2008' AS years,1080 AS sales, 1000 AS expenses
UNION
SELECT '2009' AS years,1090 AS sales, 540 AS expenses
2
3
4
5
6
7
8
9
10
11
12
UgRFDataSet06
--气泡图数据
SELECT 'CAN' AS ID,CAST('80.66' AS float) AS lifeexpe, CAST('1.67' AS float) AS fertility, 'North America' AS region, 33739900 AS [population]
UNION
SELECT 'DEU' AS ID,CAST('79.84' AS float) AS lifeexpe, CAST('1.36' AS float) AS fertility, 'Europe' AS region, 81902307 AS [population]
UNION
SELECT 'DNK' AS ID,CAST('78.6' AS float) AS lifeexpe, CAST('1.84' AS float) AS fertility, 'Europe' AS region, 5523095 AS [population]
UNION
SELECT 'EGY' AS ID,CAST('72.73' AS float) AS lifeexpe, CAST('2.78' AS float) AS fertility, 'Middle East' AS region, 79716203 AS [population]
UNION
SELECT 'GBR' AS ID,CAST('80.05' AS float) AS lifeexpe, CAST('2' AS float) AS fertility, 'Europe' AS region, 61801570 AS [population]
UNION
SELECT 'IRN' AS ID,CAST('72.49' AS float) AS lifeexpe, CAST('1.7' AS float) AS fertility, 'Middle East' AS region, 73137148 AS [population]
UNION
SELECT 'IRQ' AS ID,CAST('68.09' AS float) AS lifeexpe, CAST('4.77' AS float) AS fertility, 'Middle East' AS region, 31090763 AS [population]
UNION
SELECT 'ISR' AS ID,CAST('81.55' AS float) AS lifeexpe, CAST('2.96' AS float) AS fertility, 'Middle East' AS region, 7485600 AS [population]
UNION
SELECT 'RUS' AS ID,CAST('68.6' AS float) AS lifeexpe, CAST('1.54' AS float) AS fertility, 'Europe' AS region, 14185000 AS [population]
UNION
SELECT 'USA' AS ID,CAST('78.09' AS float) AS lifeexpe, CAST('2.05' AS float) AS fertility, 'Middle East' AS region, 307007000 AS [population]
2
3
4
5
6
7
8
9
10
11
12
13
14
15
16
17
18
19
20
UgRFDataSet07
--曲线图
SELECT '2004' AS years,1000 AS sales,400 AS expenses
UNION
SELECT '2005' AS years,1170 AS sales,490 AS expenses
UNION
SELECT '2006' AS years,660 AS sales, 460 AS expenses
UNION
SELECT '2007' AS years,1030 AS sales, 1120 AS expenses
UNION
SELECT '2008' AS years,1080 AS sales, 1000 AS expenses
UNION
SELECT '2009' AS years,1090 AS sales, 540 AS expenses
2
3
4
5
6
7
8
9
10
11
12
13
UgContainerPanel01-UgContainerPanel07属性设置
Align:设置控件的对齐方式,设置为alRight。
⑤UgFSGoogleChart01-UgFSGoogleChart属性设置
Align:设置对齐方式,设置为alClient。ChartDataSet:设置图表绑定的数据集,序号需一一对应,比如UgFSGoogleChart01的ChartDataSet需设置为UgRFDataSet01。ChartType:设置图表的类型,从控件名称编号由小到大依次设置为GeoChart、PieChart、Gauge、AreaChart、Bar、BubbleChart、LineChart。
⑥UgRadioGroup01-UgRadioGroup07属性设置
Align:设置控件的对齐方式,该控件位于UgContainerPanel中,每个控件对应编号放置于面板控件中,设置为alTop。Caption:设置选框的标题,设置为样式。Items:设置其中的选项。点击右侧的[√]打开编辑器进行编辑,根据需要添加如图,除了UgRadioGroup02为7个样式,其余的均为5个样式,以样式X进行命名。

⑦UgMemo01-UgMemo07属性设置
Align:设置控件的对齐方式,该控件位于UgContainerPanel中,每个控件对应编号放置于面板控件中,设置为alClIent。
⑧UgFSButton01属性设置
Caption:设置按钮的字幕=加载图表。
# 3. 程序设计
点击程序设计界面右下角的按钮,切换至单元选择界面,勾选需要使用的单元。该程式的程序需要引用TARSLink单元。
# 3.1. 程序初始设置
设置自定义副程序,在样式选项选择变更后,重新设置图表样式。
//JScript
function OptionChange(AChart,AMemo)
//设置选项变更内容
{
  AChart.ChartOptions.Clear;
  AChart.ChartOptions.Add(AMemo.Lines.Text);
}
2
3
4
5
6
7
//PasScript
procedure OptionChange(AChart:TUgFSGoogleChart; AMemo: TUgMemo);
//设置选项变更内容
Begin
  AChart.ChartOptions.Clear;
  AChart.ChartOptions.Add(AMemo.Lines.Text);
End;
2
3
4
5
6
7
// Make sure to add code blocks to your code group
程式启动时开启数据集。
//JScript
{
  UgRFDataSet01.Connection = GetRFWeb;
  UgRFDataSet01.SQL.Text = "SELECT 'Germany' AS position, 200 AS population " +
	"UNION SELECT 'United States' AS position, 300 AS population " +
	"UNION SELECT 'Brazil' AS position, 400 AS population " +
	"UNION SELECT 'Canada'  AS position, 500 AS population " +
	"UNION SELECT 'FRANCE' AS position, 600 AS population " +
	"UNION SELECT 'RU' AS position, 700 AS population";
  UgRFDataSet01.Open;
  UgRFDataSet02.Connection = GetRFWeb;
  UgRFDataSet02.SQL.Text = "SELECT '" + UGMM.LT("工作") + "' AS task,CAST('25.20' AS Float) AS cust,11 AS hoursperday " +
	"UNION SELECT '" + UGMM.LT("饮食") + "' AS task,CAST('40' AS Float) AS cust, 2 AS hoursperday " +
	"UNION SELECT '" + UGMM.LT("交流") + "' AS task,CAST('35.60' AS Float) AS cust, 2 AS hoursperday " +
	"UNION SELECT '" + UGMM.LT("看电视") + "' AS task,CAST('10' AS Float) AS cust, 10 AS hoursperday " +
	"UNION SELECT '" + UGMM.LT("睡觉") + "' AS task,CAST('30' AS Float) AS cust, 7 AS hoursperday";
  UgRFDataSet02.Open;
  UgRFDataSet03.Connection = GetRFWeb;
  UgRFDataSet03.SQL.Text = "SELECT '" +UGMM.LT("内存") + "' AS Label,80 AS Value " +
	"UNION SELECT 'CPU' AS Label,55 AS Value " +
	"UNION SELECT '" + UGMM.LT("网络") + "' AS Label,68 AS Value";
  UgRFDataSet03.Open;
  UgRFDataSet04.Connection = GetRFWeb;
  UgRFDataSet05.SQL.Text = "SELECT '2004' AS years,1000 AS sales,400 AS expenses " +
	"UNION SELECT '2005' AS years,1170 AS sales,490 AS expenses " +
	"UNION SELECT '2006' AS years,660 AS sales, 460 AS expenses " +
	"UNION SELECT '2007' AS years,1030 AS sales, 1120 AS expenses " +
	"UNION SELECT '2008' AS years,1080 AS sales, 1000 AS expenses " +
	"UNION SELECT '2009' AS years,1090 AS sales, 540 AS expenses";
  UgRFDataSet04.Open;
  UgRFDataSet05.Connection = GetRFWeb;
  UgRFDataSet05.SQL.Text = "SELECT '2004' AS years,1000 AS sales,400 AS expenses " +
	"UNION SELECT '2005' AS years,1170 AS sales,490 AS expenses " +
	"UNION SELECT '2006' AS years,660 AS sales, 460 AS expenses " +
	"UNION SELECT '2007' AS years,1030 AS sales, 1120 AS expenses " +
	"UNION SELECT '2008' AS years,1080 AS sales, 1000 AS expenses " +
	"UNION SELECT '2009' AS years,1090 AS sales, 540 AS expenses";
  UgRFDataSet05.Open;
  UgRFDataSet06.Connection = GetRFWeb;
  UgRFDataSet06.SQL.Text = "SELECT 'CAN' AS ID,CAST('80.66' AS float) AS lifeexpe, CAST('1.67' AS float) AS fertility, 'North America' AS region, 33739900 AS [population] " +
	"UNION SELECT 'DEU' AS ID,CAST('79.84' AS float) AS lifeexpe, CAST('1.36' AS float) AS fertility, 'Europe' AS region, 81902307 AS [population] " +
	"UNION SELECT 'DNK' AS ID,CAST('78.6' AS float) AS lifeexpe, CAST('1.84' AS float) AS fertility, 'Europe' AS region, 5523095 AS [population] " +
	"UNION SELECT 'EGY' AS ID,CAST('72.73' AS float) AS lifeexpe, CAST('2.78' AS float) AS fertility, 'Middle East' AS region, 79716203 AS [population] " +
	"UNION SELECT 'GBR' AS ID,CAST('80.05' AS float) AS lifeexpe, CAST('2' AS float) AS fertility, 'Europe' AS region, 61801570 AS [population] " +
	"UNION SELECT 'IRN' AS ID,CAST('72.49' AS float) AS lifeexpe, CAST('1.7' AS float) AS fertility, 'Middle East' AS region, 73137148 AS [population] " +
	"UNION SELECT 'IRQ' AS ID,CAST('68.09' AS float) AS lifeexpe, CAST('4.77' AS float) AS fertility, 'Middle East' AS region, 31090763 AS [population] " +
	"UNION SELECT 'ISR' AS ID,CAST('81.55' AS float) AS lifeexpe, CAST('2.96' AS float) AS fertility, 'Middle East' AS region, 7485600 AS [population] " +
	"UNION SELECT 'RUS' AS ID,CAST('68.6' AS float) AS lifeexpe, CAST('1.54' AS float) AS fertility, 'Europe' AS region, 14185000 AS [population] " +
	"UNION SELECT 'USA' AS ID,CAST('78.09' AS float) AS lifeexpe, CAST('2.05' AS float) AS fertility, 'Middle East' AS region, 307007000 AS [population]";
  UgRFDataSet06.Open;
  UgRFDataSet07.Connection = GetRFWeb;
  UgRFDataSet07.SQL.Text = "SELECT '2004' AS years,1000 AS sales,400 AS expenses " +
	"UNION SELECT '2005' AS years,1170 AS sales,490 AS expenses " +
	"UNION SELECT '2006' AS years,660 AS sales, 460 AS expenses " +
	"UNION SELECT '2007' AS years,1030 AS sales, 1120 AS expenses " +
	"UNION SELECT '2008' AS years,1080 AS sales, 1000 AS expenses " +
	"UNION SELECT '2009' AS years,1090 AS sales, 540 AS expenses";
  UgRFDataSet07.Open;
}
2
3
4
5
6
7
8
9
10
11
12
13
14
15
16
17
18
19
20
21
22
23
24
25
26
27
28
29
30
31
32
33
34
35
36
37
38
39
40
41
42
43
44
45
46
47
48
49
50
51
52
53
54
55
56
57
58
59
//PasScript
Begin
  UgRFDataSet01.Connection := GetRFWeb;
  UgRFDataSet01.SQL.Text := 'SELECT ''Germany'' AS position, 200 AS population ' +
	'UNION SELECT ''United States'' AS position, 300 AS population ' +
	'UNION SELECT ''Brazil'' AS position, 400 AS population ' +
	'UNION SELECT ''Canada''  AS position, 500 AS population ' +
	'UNION SELECT ''FRANCE'' AS position, 600 AS population ' +
	'UNION SELECT ''RU'' AS position, 700 AS population';
  UgRFDataSet01.Open;
  UgRFDataSet02.Connection := GetRFWeb;
  UgRFDataSet02.SQL.Text := 'SELECT ''' + UGMM.LT('工作') + ''' AS task,CAST(''25.20'' AS Float) AS cust,11 AS hoursperday ' +
	'UNION SELECT ''' + UGMM.LT('饮食') + ''' AS task,CAST(''40'' AS Float) AS cust, 2 AS hoursperday ' +
	'UNION SELECT ''' + UGMM.LT('交流') + ''' AS task,CAST(''35.60'' AS Float) AS cust, 2 AS hoursperday ' +
	'UNION SELECT ''' + UGMM.LT('看电视') + ''' AS task,CAST(''10'' AS Float) AS cust, 10 AS hoursperday ' +
	'UNION SELECT ''' + UGMM.LT('睡觉') + ''' AS task,CAST(''30'' AS Float) AS cust, 7 AS hoursperday';
  UgRFDataSet02.Open;
  UgRFDataSet03.Connection := GetRFWeb;
  UgRFDataSet03.SQL.Text := 'SELECT ''' +UGMM.LT('内存') + ''' AS Label,80 AS Value ' +
	'UNION SELECT ''CPU'' AS Label,55 AS Value ' +
	'UNION SELECT ''' + UGMM.LT('网络') + ''' AS Label,68 AS Value';
  UgRFDataSet03.Open;
  UgRFDataSet04.Connection := GetRFWeb;
  UgRFDataSet05.SQL.Text := 'SELECT ''2004'' AS years,1000 AS sales,400 AS expenses ' +
	'UNION SELECT ''2005'' AS years,1170 AS sales,490 AS expenses ' +
	'UNION SELECT ''2006'' AS years,660 AS sales, 460 AS expenses ' +
	'UNION SELECT ''2007'' AS years,1030 AS sales, 1120 AS expenses ' +
	'UNION SELECT ''2008'' AS years,1080 AS sales, 1000 AS expenses ' +
	'UNION SELECT ''2009'' AS years,1090 AS sales, 540 AS expenses';
  UgRFDataSet04.Open;
  UgRFDataSet05.Connection := GetRFWeb;
  UgRFDataSet05.SQL.Text := 'SELECT ''2004'' AS years,1000 AS sales,400 AS expenses ' +
	'UNION SELECT ''2005'' AS years,1170 AS sales,490 AS expenses ' +
	'UNION SELECT ''2006'' AS years,660 AS sales, 460 AS expenses ' +
	'UNION SELECT ''2007'' AS years,1030 AS sales, 1120 AS expenses ' +
	'UNION SELECT ''2008'' AS years,1080 AS sales, 1000 AS expenses ' +
	'UNION SELECT ''2009'' AS years,1090 AS sales, 540 AS expenses';
  UgRFDataSet05.Open;
  UgRFDataSet06.Connection := GetRFWeb;
  UgRFDataSet06.SQL.Text := 'SELECT ''CAN'' AS ID,CAST(''80.66'' AS float) AS lifeexpe, CAST(''1.67'' AS float) AS fertility, ''North America'' AS region, 33739900 AS [population] ' +
	'UNION SELECT ''DEU'' AS ID,CAST(''79.84'' AS float) AS lifeexpe, CAST(''1.36'' AS float) AS fertility, ''Europe'' AS region, 81902307 AS [population] ' +
	'UNION SELECT ''DNK'' AS ID,CAST(''78.6'' AS float) AS lifeexpe, CAST(''1.84'' AS float) AS fertility, ''Europe'' AS region, 5523095 AS [population] ' +
	'UNION SELECT ''EGY'' AS ID,CAST(''72.73'' AS float) AS lifeexpe, CAST(''2.78'' AS float) AS fertility, ''Middle East'' AS region, 79716203 AS [population] ' +
	'UNION SELECT ''GBR'' AS ID,CAST(''80.05'' AS float) AS lifeexpe, CAST(''2'' AS float) AS fertility, ''Europe'' AS region, 61801570 AS [population] ' +
	'UNION SELECT ''IRN'' AS ID,CAST(''72.49'' AS float) AS lifeexpe, CAST(''1.7'' AS float) AS fertility, ''Middle East'' AS region, 73137148 AS [population] ' +
	'UNION SELECT ''IRQ'' AS ID,CAST(''68.09'' AS float) AS lifeexpe, CAST(''4.77'' AS float) AS fertility, ''Middle East'' AS region, 31090763 AS [population] ' +
	'UNION SELECT ''ISR'' AS ID,CAST(''81.55'' AS float) AS lifeexpe, CAST(''2.96'' AS float) AS fertility, ''Middle East'' AS region, 7485600 AS [population] ' +
	'UNION SELECT ''RUS'' AS ID,CAST(''68.6'' AS float) AS lifeexpe, CAST(''1.54'' AS float) AS fertility, ''Europe'' AS region, 14185000 AS [population] ' +
	'UNION SELECT ''USA'' AS ID,CAST(''78.09'' AS float) AS lifeexpe, CAST(''2.05'' AS float) AS fertility, ''Middle East'' AS region, 307007000 AS [population]';
  UgRFDataSet06.Open;
  UgRFDataSet07.Connection := GetRFWeb;
  UgRFDataSet07.SQL.Text := 'SELECT ''2004'' AS years,1000 AS sales,400 AS expenses ' +
	'UNION SELECT ''2005'' AS years,1170 AS sales,490 AS expenses ' +
	'UNION SELECT ''2006'' AS years,660 AS sales, 460 AS expenses ' +
	'UNION SELECT ''2007'' AS years,1030 AS sales, 1120 AS expenses ' +
	'UNION SELECT ''2008'' AS years,1080 AS sales, 1000 AS expenses ' +
	'UNION SELECT ''2009'' AS years,1090 AS sales, 540 AS expenses';
  UgRFDataSet07.Open;
End.
2
3
4
5
6
7
8
9
10
11
12
13
14
15
16
17
18
19
20
21
22
23
24
25
26
27
28
29
30
31
32
33
34
35
36
37
38
39
40
41
42
43
44
45
46
47
48
49
50
51
52
53
54
55
56
57
58
59
// Make sure to add code blocks to your code group
# 3.2. 事件设置
- ⑧UgFSButton01-OnClick事件
点击[加载图表]按钮,开启图表。
//JScript
function UgFSButton01OnClick(sender)
//点击加载图片
{
  switch (UgPageControl01.TabIndex) {
  case 0: {UgFSGoogleChart01.LoadChart; }
  case 1: {UgFSGoogleChart02.LoadChart; }
  case 2: {UgFSGoogleChart03.LoadChart; }
  case 3: {UgFSGoogleChart04.LoadChart; }
  case 4: {UgFSGoogleChart05.LoadChart; }
  case 5: {UgFSGoogleChart06.LoadChart; }
  case 6: {UgFSGoogleChart07.LoadChart; }
  }
}
2
3
4
5
6
7
8
9
10
11
12
13
14
//PasScript
procedure UgFSButton01OnClick(sender: tobject);
//点击加载图片
begin
  case UgPageControl01.TabIndex of
  0: UgFSGoogleChart01.LoadChart;
  1: UgFSGoogleChart02.LoadChart;
  2: UgFSGoogleChart03.LoadChart;
  3: UgFSGoogleChart04.LoadChart;
  4: UgFSGoogleChart05.LoadChart;
  5: UgFSGoogleChart06.LoadChart;
  6: UgFSGoogleChart07.LoadChart;
  end;
end;
2
3
4
5
6
7
8
9
10
11
12
13
14
// Make sure to add code blocks to your code group
- ⑥UgRadioGroup01-UgRadioGroup07-OnClick属性设置
点击样式选框中的样式,变更图表显示的样式。
//JScript
function UgRadioGroup01OnClick(sender)
//设置地形图样式选项
{
  switch (UgRadioGroup01.ItemIndex) {
  case 0: {UgMemo01.Lines.Text = "displayMode: \"markers\",";}
  case 1: {UgMemo01.Lines.Text = "displayMode: \"text\","; }
  case 2: {UgMemo01.Lines.Text = "displayMode: \"region\","; }
  case 3:
  {
    UgMemo01.Lines.Clear;
    UgMemo01.Lines.Add("displayMode: \"region\",");
    UgMemo01.Lines.Add("colorAxis: {colors: [\"green\", \"blue\"]}, ");
  }
  case 4:
  {
    UgMemo01.Lines.Clear;
    UgMemo01.Lines.Add("displayMode: \"region\",");
    UgMemo01.Lines.add("backgroundColor: \"#81d4fa\",");
    UgMemo01.Lines.Add("colorAxis: {colors: [\"#00853f\", \"black\", \"#e31b23\"]},");
    UgMemo01.Lines.Add("tooltip: {textStyle: {color: \"#FF0000\"}, showColorCode: true},");
  }
  }
  //ShowMessage("1");
  OptionChange(UgFSGoogleChart01,UgMemo01);
  UgFSButton01.Click;
}

function UgRadioGroup02OnClick(sender)
//设置饼图样式选项
{
  switch (UgRadioGroup02.ItemIndex) {
  case 0:
  {
    UgMemo02.Lines.Clear;
    UgMemo02.Lines.Add("title: \"My Daily Activities (1)\", ");
    UgMemo02.Lines.Add("tooltip: {textStyle: {color: \"#FF0000\"}, showColorCode: true},");
  }
  case 1:
  {
    UgMemo02.Lines.Clear;
    UgMemo02.Lines.Add("title: \"My Daily Activities (2)\", ");
    UgMemo02.Lines.Add("is3D: true, ");
  }
  case 2:
  {
    UgMemo02.Lines.Clear;
    UgMemo02.Lines.Add("title: \"My Daily Activities (3)\", ");
    UgMemo02.Lines.Add("pieHole: 0.4,");
  }
  case 3:
  {
    UgMemo02.Lines.Clear;
    UgMemo02.Lines.Add("title: \"My Daily Activities (4)\", ");
    UgMemo02.Lines.Add("sliceVisibilityThreshold: .2 ");
  }
  case 4:
  {
    UgMemo02.Lines.Clear;
    UgMemo02.Lines.Add("legend: \"none\",");
    UgMemo02.Lines.add("pieStartAngle: 100,");
  }
  case 5: {UgMemo02.Lines.Text = "pieSliceText: \"label\", "; }
  case 6: {UgMemo02.Lines.Text = "pieSliceText: \"value\", "; }
  }
  OptionChange(UgFSGoogleChart02,UgMemo02);
  UgFSButton01.Click;
}

function UgRadioGroup03OnClick(sender)
//设置仪表盘样式
{
switch(UgRadioGroup03.ItemIndex) {
  case 0: {UgMemo03.Lines.Clear;}
  case 1:
  {
    UgMemo03.Lines.Clear;
    UgMemo03.Lines.Add("width: 400, height: 120, ");
    UgMemo03.Lines.Add("redFrom: 90, redTo: 100, ");
    UgMemo03.Lines.Add("yellowFrom:75, yellowTo: 90, ");
    UgMemo03.Lines.Add("minorTicks: 5, ");
  }
  case 2:
  {
    UgMemo03.Lines.Clear;
    UgMemo03.Lines.Add("redFrom: 90, redTo: 100, ");
    UgMemo03.Lines.Add("yellowFrom:75, yellowTo: 90, ");
    UgMemo03.Lines.Add("minorTicks: 5, ");
  }
  case 3:
  {
    UgMemo03.Lines.Clear;
    UgMemo03.Lines.Add("redFrom: 50, redTo: 100, ");
    UgMemo03.Lines.Add("yellowFrom:50, yellowTo: 90, ");
    UgMemo03.Lines.Add("minorTicks: 5, ");
  }
  case 4:
  {
    UgMemo03.Lines.Clear;
    UgMemo03.Lines.Add("redFrom: 90, redTo: 200, ");
    UgMemo03.Lines.add("yellowFrom:75, yellowTo: 90, ");
    UgMemo03.Lines.Add("min: 50, ");
    UgMemo03.Lines.Add("max: 200, ");
  }
  }
  OptionChange(UgFSGoogleChart03,UgMemo03);
  UgFSButton01.Click;
}

function UgRadioGroup04OnClick(sender)
//设置面积图样式
{
  switch(UgRadioGroup04.ItemIndex) {
  case 0:
  {
    UgMemo04.Lines.Clear;
    UgMemo04.Lines.Add("title: \"Company Performance\", ");
    UgMemo04.Lines.Add("curveType: \"none\", ");
    UgMemo04.Lines.Add("legend: { position: \"right\"}, ");
  }
  case 1:
  {
    UgMemo04.Lines.Clear;
    UgMemo04.Lines.Add("title: \"Company Performance\", ");
    UgMemo04.Lines.Add("curveType: \"function\", ");
    UgMemo04.Lines.Add("legend: { position: \"bottom\" }, ");
  }
  case 2:
  {
    UgMemo04.Lines.Clear;
    UgMemo04.Lines.Add("title: \"Company Performance\", ");
    UgMemo04.Lines.Add("curveType: \"function\", ");
    UgMemo04.Lines.Add("legend: { position: \"bottom\" }, ");
    UgMemo04.Lines.Add("orientation: \"vertical\", ");
  }
  case 3:
  {
    UgMemo04.Lines.Clear;
    UgMemo04.Lines.Add("title: \"Company Performance\", ");
    UgMemo04.Lines.Add("curveType: \"function\", ");
    UgMemo04.Lines.Add("legend: { position: \"bottom\" }, ");
    UgMemo04.Lines.Add("orientation: \"horizontal\", ");
  }
  case 4:
  {
    UgMemo04.Lines.Clear;
    UgMemo04.Lines.Add("title: \"Company Performance\", ");
    UgMemo04.Lines.add("curveType: \"none\", ");
    UgMemo04.Lines.Add("legend: { position: \"right\"}, ");
    UgMemo04.Lines.Add("selectionMode: \"multiple\", ");
  }
  }
  OptionChange(UgFSGoogleChart04,UgMemo04);
  UgFSButton01.Click;
}

function UgRadioGroup05OnClick(sender)
//设置棒状图样式
{
  switch(UgRadioGroup05.ItemIndex) {
  case 0:
  {
    UgMemo05.Lines.Clear;
    UgMemo05.Lines.Add("title: \"Company Performance\", ");
    UgMemo05.Lines.Add("legend: { position: \"none\"}, ");
    UgMemo05.Lines.Add("isStacked: true, ");
  }
  case 1:
  {
    UgMemo05.Lines.Clear;
    UgMemo05.Lines.Add("title: \"Company Performance\", ");
    UgMemo05.Lines.Add("subtitle: \"Sales, Expenses, and Profit: 2014-2017\", ");
    UgMemo05.Lines.Add("legend: { position: \"bottom\", maxLines: 3 }, ");
  }
  case 2:
  {
    UgMemo05.Lines.Clear;
    UgMemo05.Lines.Add("title: \"Company Performance\", ");
    UgMemo05.Lines.Add("legend: { position: \"bottom\", maxLines: 3 }, ");
    UgMemo05.Lines.Add("orientation: \"vertical\", ");
  }
  case 3:
  {
    UgMemo05.Lines.Clear;
    UgMemo05.Lines.Add("title: \"Company Performance\", ");
    UgMemo05.Lines.Add("legend: { position: \"bottom\", maxLines: 3 }, ");
    UgMemo05.Lines.Add("orientation: \"horizontal\", ");
  }
  case 4:
  {
    UgMemo05.Lines.Clear;
    UgMemo05.Lines.Add("title: \"Company Performance\", ");
    UgMemo05.Lines.Add("legend: { position: \"right\"}, ");
    UgMemo05.Lines.Add("selectionMode: \"multiple\", ");
  }
  }
  OptionChange(UgFSGoogleChart05,UgMemo05);
  UgFSButton01.Click;
}

function UgRadioGroup06OnClick(sender)
//泡泡图样式
{
  switch (UgRadioGroup06.ItemIndex) {
  case 0:
  {
    UgMemo06.Lines.Clear;
    UgMemo06.Lines.Add(" hAxis: {title: \"预期寿命\"}, ");
    UgMemo06.Lines.Add(" vAxis: {title: \"生育率\"}, ");
    UgMemo06.Lines.Add("bubble: { ");
    UgMemo06.Lines.Add("  textStyle: { ");
    UgMemo06.Lines.Add("    fontSize: 12, ");
    UgMemo06.Lines.Add("    fontName: \"Times-Roman\", ");
    UgMemo06.Lines.Add("    color: \"green\", ");
    UgMemo06.Lines.Add("    bold: true, ");
    UgMemo06.Lines.Add("     italic: true ");
    UgMemo06.Lines.Add("   } ");
    UgMemo06.Lines.Add(" }, ");
  }
  case 1:
  {
    UgMemo06.Lines.Clear;
    UgMemo06.Lines.Add(" title: \"预期寿命之间的关系\", ");
    UgMemo06.Lines.Add(" hAxis: {title: \"预期寿命\"}, ");
    UgMemo06.Lines.Add(" vAxis: {title: \"生育率\"}, ");
    UgMemo06.Lines.Add(" bubble: {textStyle: {fontSize: 11}}, ");
  }
  case 2:
  {
    UgMemo06.Lines.Clear;
    UgMemo06.Lines.Add(" title: \"预期寿命之间的关系\", ");
  }
  case 3:
  {
    UgMemo06.Lines.Clear;
    UgMemo06.Lines.Add(" hAxis: {title: \"Other1\"}, ");
    UgMemo06.Lines.Add(" hAxis: {title: \"New\"}, ");
  }
  case 4:
  {
    UgMemo06.Lines.Clear;
    UgMemo06.Lines.Add("title: \"Many possibility\", ");
  }
  }
  OptionChange(UgFSGoogleChart06,UgMemo06);
  UgFSButton01.Click;
}

function UgRadioGroup07OnClick(sender)
//曲线图样式
{
switch(UgRadioGroup07.ItemIndex) {
  case 0:
  {
    UgMemo07.Lines.Clear;
    UgMemo07.Lines.Add("title: \"Company Performance\", ");
    UgMemo07.Lines.Add("curveType: \"none\", ");
    UgMemo07.Lines.Add("legend: { position: \"right\"}, ");
  }
  case 1:
  {
    UgMemo07.Lines.Clear;
    UgMemo07.Lines.Add("title: \"Company Performance\", ");
    UgMemo07.Lines.Add("curveType: \"function\", ");
    UgMemo07.Lines.Add("legend: { position: \"bottom\" }, ");
  }
  case 2:
  {
    UgMemo07.Lines.Clear;
    UgMemo07.Lines.Add("title: \"Company Performance\", ");
    UgMemo07.Lines.Add("curveType: \"function\", ");
    UgMemo07.Lines.Add("legend: { position: \"bottom\" }, ");
    UgMemo07.Lines.Add("orientation: \"vertical\", ");
  }
  case 3:
  {
    UgMemo07.Lines.Clear;
    UgMemo07.Lines.Add("title: \"Company Performance\", ");
    UgMemo07.Lines.Add("curveType: \"function\", ");
    UgMemo07.Lines.Add("legend: { position: \"bottom\" }, ");
    UgMemo07.Lines.Add("orientation: \"horizontal\", ");
  }
  case 4:
  {
    UgMemo07.Lines.Clear;
    UgMemo07.Lines.Add("title: \"Company Performance\", ");
    UgMemo07.Lines.add("curveType: \"none\", ");
    UgMemo07.Lines.Add("legend: { position: \"right\"}, ");
    UgMemo07.Lines.Add("selectionMode: \"multiple\", ");
  }
  }
  OptionChange(UgFSGoogleChart07,UgMemo07);
  UgFSButton01.Click;
}
2
3
4
5
6
7
8
9
10
11
12
13
14
15
16
17
18
19
20
21
22
23
24
25
26
27
28
29
30
31
32
33
34
35
36
37
38
39
40
41
42
43
44
45
46
47
48
49
50
51
52
53
54
55
56
57
58
59
60
61
62
63
64
65
66
67
68
69
70
71
72
73
74
75
76
77
78
79
80
81
82
83
84
85
86
87
88
89
90
91
92
93
94
95
96
97
98
99
100
101
102
103
104
105
106
107
108
109
110
111
112
113
114
115
116
117
118
119
120
121
122
123
124
125
126
127
128
129
130
131
132
133
134
135
136
137
138
139
140
141
142
143
144
145
146
147
148
149
150
151
152
153
154
155
156
157
158
159
160
161
162
163
164
165
166
167
168
169
170
171
172
173
174
175
176
177
178
179
180
181
182
183
184
185
186
187
188
189
190
191
192
193
194
195
196
197
198
199
200
201
202
203
204
205
206
207
208
209
210
211
212
213
214
215
216
217
218
219
220
221
222
223
224
225
226
227
228
229
230
231
232
233
234
235
236
237
238
239
240
241
242
243
244
245
246
247
248
249
250
251
252
253
254
255
256
257
258
259
260
261
262
263
264
265
266
267
268
269
270
271
272
273
274
275
276
277
278
279
280
281
282
283
284
285
286
287
288
289
290
291
292
293
294
//PasScript
procedure UgRadioGroup01OnClick(sender: tobject);
//设置地形图样式选项
begin
  case UgRadioGroup01.ItemIndex of
  0: UgMemo01.Lines.Text := 'displayMode: "markers",';
  1: UgMemo01.Lines.Text := 'displayMode: "text",';
  2: UgMemo01.Lines.Text := 'displayMode: "region",';
  3:
  Begin
    UgMemo01.Lines.Clear;
    UgMemo01.Lines.Add('displayMode: "region",');
    UgMemo01.Lines.Add('colorAxis: {colors: ["green", "blue"]}, ');
  end;
  4:
  Begin
    UgMemo01.Lines.Clear;
    UgMemo01.Lines.Add('displayMode: "region",');
    UgMemo01.Lines.add('backgroundColor: "#81d4fa",');
    UgMemo01.Lines.Add('colorAxis: {colors: ["#00853f", "black", "#e31b23"]},');
    UgMemo01.Lines.Add('tooltip: {textStyle: {color: "#FF0000"}, showColorCode: true},');
  End;
  End;
  OptionChange(UgFSGoogleChart01,UgMemo01);
  UgFSButton01.Click;
end;

procedure UgRadioGroup02OnClick(sender: tobject);
//设置饼图样式选项
begin
  case UgRadioGroup02.ItemIndex of
  0:
  begin
    UgMemo02.Lines.Clear;
    UgMemo02.Lines.Add('title: "My Daily Activities (1)", ');
    UgMemo02.Lines.Add('tooltip: {textStyle: {color: "#FF0000"}, showColorCode: true},');
  end;
  1:
  begin
    UgMemo02.Lines.Clear;
    UgMemo02.Lines.Add('title: "My Daily Activities (2)", ');
    UgMemo02.Lines.Add('is3D: true, ');
  end;
  2:
  Begin
    UgMemo02.Lines.Clear;
    UgMemo02.Lines.Add('title: "My Daily Activities (3)", ');
    UgMemo02.Lines.Add('pieHole: 0.4,');
  end;
  3:
  Begin
    UgMemo02.Lines.Clear;
    UgMemo02.Lines.Add('title: "My Daily Activities (4)", ');
    UgMemo02.Lines.Add('sliceVisibilityThreshold: .2 ');
  end;
  4:
  Begin
    UgMemo02.Lines.Clear;
    UgMemo02.Lines.Add('legend: "none",');
    UgMemo02.Lines.add('pieStartAngle: 100,');
  End;
  5: UgMemo02.Lines.Text := 'pieSliceText: "label", ';
  6: UgMemo02.Lines.Text := 'pieSliceText: "value", ';
  End;
  OptionChange(UgFSGoogleChart02,UgMemo02);
  UgFSButton01.Click;
end;

procedure UgRadioGroup03OnClick(sender: tobject);
//设置仪表盘样式
begin
  case UgRadioGroup03.ItemIndex of
  0:
  begin
    UgMemo03.Lines.Clear;
  end;
  1:
  begin
    UgMemo03.Lines.Clear;
    UgMemo03.Lines.Add('width: 400, height: 120, ');
    UgMemo03.Lines.Add('redFrom: 90, redTo: 100, ');
    UgMemo03.Lines.Add('yellowFrom:75, yellowTo: 90, ');
    UgMemo03.Lines.Add('minorTicks: 5, ');
  end;
  2:
  Begin
    UgMemo03.Lines.Clear;
    UgMemo03.Lines.Add('redFrom: 90, redTo: 100, ');
    UgMemo03.Lines.Add('yellowFrom:75, yellowTo: 90, ');
    UgMemo03.Lines.Add('minorTicks: 5, ');
  end;
  3:
  Begin
    UgMemo03.Lines.Clear;
    UgMemo03.Lines.Add('redFrom: 50, redTo: 100, ');
    UgMemo03.Lines.Add('yellowFrom:50, yellowTo: 90, ');
    UgMemo03.Lines.Add('minorTicks: 5, ');
  end;
  4:
  Begin
    UgMemo03.Lines.Clear;
    UgMemo03.Lines.Add('redFrom: 90, redTo: 200, ');
    UgMemo03.Lines.add('yellowFrom:75, yellowTo: 90, ');
    UgMemo03.Lines.Add('min: 50, ');
    UgMemo03.Lines.Add('max: 200, ');
  End;
  End;
  OptionChange(UgFSGoogleChart03,UgMemo03);
  UgFSButton01.Click;
end;

procedure UgRadioGroup04OnClick(sender: tobject);
//设置面积图样式
begin
  case UgRadioGroup04.ItemIndex of
  0:
  begin
    UgMemo04.Lines.Clear;
    UgMemo04.Lines.Add('title: "Company Performance", ');
    UgMemo04.Lines.Add('curveType: "none", ');
    UgMemo04.Lines.Add('legend: { position: "right"}, ');
  end;
  1:
  begin
    UgMemo04.Lines.Clear;
    UgMemo04.Lines.Add('title: "Company Performance", ');
    UgMemo04.Lines.Add('curveType: "function", ');
    UgMemo04.Lines.Add('legend: { position: "bottom" }, ');
  end;
  2:
  Begin
    UgMemo04.Lines.Clear;
    UgMemo04.Lines.Add('title: "Company Performance", ');
    UgMemo04.Lines.Add('curveType: "function", ');
    UgMemo04.Lines.Add('legend: { position: "bottom" }, ');
    UgMemo04.Lines.Add('orientation: "vertical", ');
  end;
  3:
  Begin
    UgMemo04.Lines.Clear;
    UgMemo04.Lines.Add('title: "Company Performance", ');
    UgMemo04.Lines.Add('curveType: "function", ');
    UgMemo04.Lines.Add('legend: { position: "bottom" }, ');
    UgMemo04.Lines.Add('orientation: "horizontal", ');
  end;
  4:
  Begin
    UgMemo04.Lines.Clear;
    UgMemo04.Lines.Add('title: "Company Performance", ');
    UgMemo04.Lines.add('curveType: "none", ');
    UgMemo04.Lines.Add('legend: { position: "right"}, ');
    UgMemo04.Lines.Add('selectionMode: "multiple", ');
  End;
  End;
  OptionChange(UgFSGoogleChart04,UgMemo04);
  UgFSButton01.Click;
end;

procedure UgRadioGroup05OnClick(sender: tobject);
//设置棒状图样式
begin
  case UgRadioGroup05.ItemIndex of
  0:
  begin
    UgMemo05.Lines.Clear;
    UgMemo05.Lines.Add('title: "Company Performance", ');
    UgMemo05.Lines.Add('legend: { position: "none"}, ');
    UgMemo05.Lines.Add('isStacked: true, ');
  end;
  1:
  begin
    UgMemo05.Lines.Clear;
    UgMemo05.Lines.Add('title: "Company Performance", ');
    UgMemo05.Lines.Add('subtitle: "Sales, Expenses, and Profit: 2014-2017", ');
    UgMemo05.Lines.Add('legend: { position: "bottom", maxLines: 3 }, ');
  end;
  2:
  Begin
    UgMemo05.Lines.Clear;
    UgMemo05.Lines.Add('title: "Company Performance", ');
    UgMemo05.Lines.Add('legend: { position: "bottom", maxLines: 3 }, ');
    UgMemo05.Lines.Add('orientation: "vertical", ');
  end;
  3:
  Begin
    UgMemo05.Lines.Clear;
    UgMemo05.Lines.Add('title: "Company Performance", ');
    UgMemo05.Lines.Add('legend: { position: "bottom", maxLines: 3 }, ');
    UgMemo05.Lines.Add('orientation: "horizontal", ');
  end;
  4:
  Begin
    UgMemo05.Lines.Clear;
    UgMemo05.Lines.Add('title: "Company Performance", ');
    UgMemo05.Lines.Add('legend: { position: "right"}, ');
    UgMemo05.Lines.Add('selectionMode: "multiple", ');
  End;
  End;
  OptionChange(UgFSGoogleChart05,UgMemo05);
  UgFSButton01.Click;
end;

procedure UgRadioGroup06OnClick(sender: tobject);
//泡泡图样式
begin
  case UgRadioGroup06.ItemIndex of
  0:
  begin
    UgMemo06.Lines.Clear;
    UgMemo06.Lines.Add(' hAxis: {title: "预期寿命"}, ');
    UgMemo06.Lines.Add(' vAxis: {title: "生育率"}, ');
    UgMemo06.Lines.Add('bubble: { ');
    UgMemo06.Lines.Add('  textStyle: { ');
    UgMemo06.Lines.Add('    fontSize: 12, ');
    UgMemo06.Lines.Add('    fontName: "Times-Roman", ');
    UgMemo06.Lines.Add('    color: "green", ');
    UgMemo06.Lines.Add('    bold: true, ');
    UgMemo06.Lines.Add('     italic: true ');
    UgMemo06.Lines.Add('   } ');
    UgMemo06.Lines.Add(' }, ');
  end;
  1:
  begin
    UgMemo06.Lines.Clear;
    UgMemo06.Lines.Add(' title: "预期寿命之间的关系", ');
    UgMemo06.Lines.Add(' hAxis: {title: "预期寿命"}, ');
    UgMemo06.Lines.Add(' vAxis: {title: "生育率"}, ');
    UgMemo06.Lines.Add(' bubble: {textStyle: {fontSize: 11}}, ');
  end;
  2:
  Begin
    UgMemo06.Lines.Clear;
    UgMemo06.Lines.Add(' title: "预期寿命之间的关系", ');
  end;
  3:
  Begin
    UgMemo06.Lines.Clear;
    UgMemo06.Lines.Add(' hAxis: {title: "Other1"}, ');
    UgMemo06.Lines.Add(' hAxis: {title: "New"}, ');
  end;
  4:
  Begin
    UgMemo06.Lines.Clear;
    UgMemo06.Lines.Add('title: "Many possibility", ');
  End;
  End;
  OptionChange(UgFSGoogleChart06,UgMemo06);
  UgFSButton01.Click;
end;

procedure UgRadioGroup07OnClick(sender: tobject);
//曲线图样式
begin
  case UgRadioGroup07.ItemIndex of
  0:
  begin
    UgMemo07.Lines.Clear;
    UgMemo07.Lines.Add('title: "Company Performance", ');
    UgMemo07.Lines.Add('curveType: "none", ');
    UgMemo07.Lines.Add('legend: { position: "right"}, ');
  end;
  1:
  begin
    UgMemo07.Lines.Clear;
    UgMemo07.Lines.Add('title: "Company Performance", ');
    UgMemo07.Lines.Add('curveType: "function", ');
    UgMemo07.Lines.Add('legend: { position: "bottom" }, ');
  end;
  2:
  Begin
    UgMemo07.Lines.Clear;
    UgMemo07.Lines.Add('title: "Company Performance", ');
    UgMemo07.Lines.Add('curveType: "function", ');
    UgMemo07.Lines.Add('legend: { position: "bottom" }, ');
    UgMemo07.Lines.Add('orientation: "vertical", ');
  end;
  3:
  Begin
    UgMemo07.Lines.Clear;
    UgMemo07.Lines.Add('title: "Company Performance", ');
    UgMemo07.Lines.Add('curveType: "function", ');
    UgMemo07.Lines.Add('legend: { position: "bottom" }, ');
    UgMemo07.Lines.Add('orientation: "horizontal", ');
  end;
  4:
  Begin
    UgMemo07.Lines.Clear;
    UgMemo07.Lines.Add('title: "Company Performance", ');
    UgMemo07.Lines.add('curveType: "none", ');
    UgMemo07.Lines.Add('legend: { position: "right"}, ');
    UgMemo07.Lines.Add('selectionMode: "multiple", ');
  End;
  End;
  OptionChange(UgFSGoogleChart07,UgMemo07);
  UgFSButton01.Click;
end;
2
3
4
5
6
7
8
9
10
11
12
13
14
15
16
17
18
19
20
21
22
23
24
25
26
27
28
29
30
31
32
33
34
35
36
37
38
39
40
41
42
43
44
45
46
47
48
49
50
51
52
53
54
55
56
57
58
59
60
61
62
63
64
65
66
67
68
69
70
71
72
73
74
75
76
77
78
79
80
81
82
83
84
85
86
87
88
89
90
91
92
93
94
95
96
97
98
99
100
101
102
103
104
105
106
107
108
109
110
111
112
113
114
115
116
117
118
119
120
121
122
123
124
125
126
127
128
129
130
131
132
133
134
135
136
137
138
139
140
141
142
143
144
145
146
147
148
149
150
151
152
153
154
155
156
157
158
159
160
161
162
163
164
165
166
167
168
169
170
171
172
173
174
175
176
177
178
179
180
181
182
183
184
185
186
187
188
189
190
191
192
193
194
195
196
197
198
199
200
201
202
203
204
205
206
207
208
209
210
211
212
213
214
215
216
217
218
219
220
221
222
223
224
225
226
227
228
229
230
231
232
233
234
235
236
237
238
239
240
241
242
243
244
245
246
247
248
249
250
251
252
253
254
255
256
257
258
259
260
261
262
263
264
265
266
267
268
269
270
271
272
273
274
275
276
277
278
279
280
281
282
283
284
285
286
287
288
289
290
291
292
293
294
295
296
// Make sure to add code blocks to your code group
# 4. 运行结果
使用鼠标在FastWeb菜单,点击[保存至数据库]按钮,将其保存至数据库,点击[调试运行]确认能够正常打开。
点击页面区域可切换显示的图表类型,点击[加载图表]按钮加载对应页面的图表。点击右侧的样式选框可选择对应的样式进行图表的加载。